Since 2017, Wisconsin’s economy has continued to grow, but has done so at a pace that lags much of the country. This report examines the state’s growth in six key measures: population, labor force, real gross domestic product (GDP), per capita personal income, median household income, and poverty. By examining these six indicators at the state and county level, we assess Wisconsin’s performance relative to national peers.
Viewed in isolation, Wisconsin appears economically strong. Since 2017, output increased, incomes rose modestly, and poverty declined. However, given the demographic challenges faced by Wisconsin and its counties, relative comparisons paint a more challenging picture.
Wisconsin ranked in the bottom third of states on population growth and labor force growth from 2017 through 2024. These demographic constraints have limited the state’s ability to grow economically. Real GDP in Wisconsin grew by 10.1% since 2017, which is roughly half of the national rate and ranked 38th nationally. Income growth followed a similar pattern during the same period. Per capita personal income and median household income grew slower in Wisconsin compared to most other states. On the other hand, Wisconsin fared comparatively well in reducing the share of residents living below the poverty line.
At the county level, population growth was one area in which Wisconsin fared well. At the same time, growth in the labor force lagged, which suggests population growth was driven by an increase in residents who are not participating in the workforce.
Overall, the challenges facing Wisconsin are based on persistently modest growth in an increasingly competitive environment. Slowing population growth and labor force expansion, especially relative to other states and regions, have limited growth in output and growth in personal and household income. Consistently slow growth puts Wisconsin and its counties at risk of falling further behind. Addressing underlying demographic challenges is central to improving the state’s long-term economic vitality.
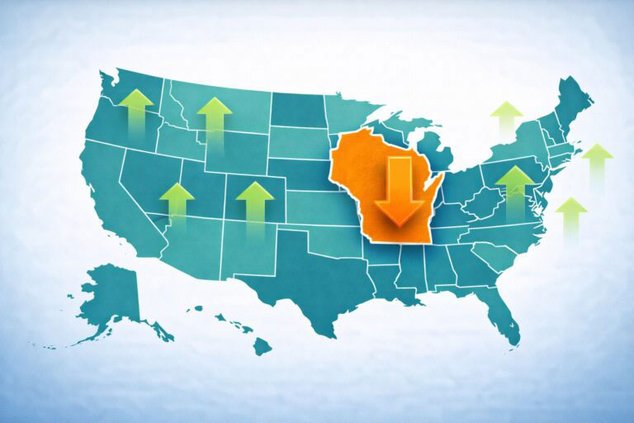
Keeping Pace? Wisconsin’s Economic Performance Since 2017
In 2018, despite a growing economy, Wisconsin’s labor force declined for the f irst time since 2012 when the state was climbing out of the Great Recession. By 2022, the state’s workforce was 1.2% smaller than in 2017. Wisconsin was not alone in this dilemma; 18 states saw the size of their workforce decline during this five-year period.
While Wisconsin’s decline was surprising for many, some analysts saw it coming. In 2004, a Wisconsin Taxpayers Alliance report noted that the state’s demographics were such that its workforce was likely to level off after 2015 and then begin declining.
This prediction mostly held true. However, in 2023 and 2024, the state’s labor force unexpectedly grew, erasing losses from the prior f ive years. Immigration likely played a large role in these gains. However, by December of 2025 a decline of nearly 67,000 workers erased much of these gains.
Because workforce is critical to economic success, these changes since 2017 raise a broader question about the state’s overall economic vitality: has Wisconsin kept pace on other economic indicators? To examine that question, changes in six economic measures since 2017 are examined at both the state and county levels.
EVALUATING THE ECONOMY
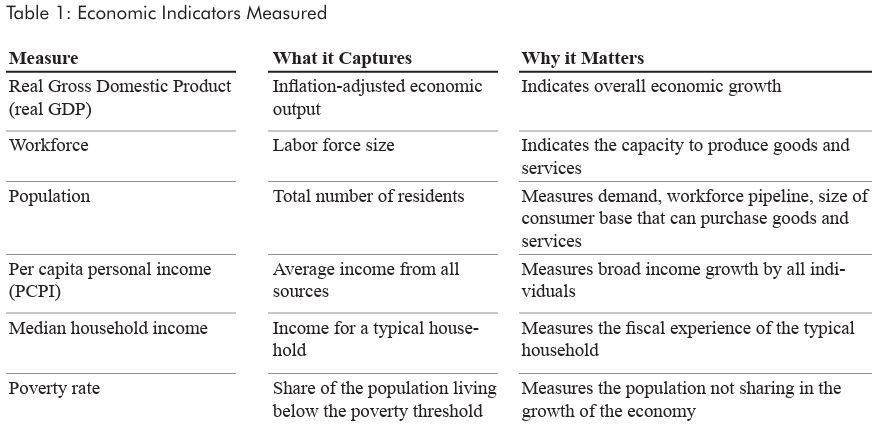
There are many ways to think about the economic vitality of a state or county. For purposes of this report, economic vitality is measured through six indicators, categorized by inputs (population and workforce), outputs (real gross domestic product), and economic outcomes (per capita personal income, median household 1 “Wisconsin’s Future: 2015 and Beyond,” The Wisconsin Taxpayer, Wisconsin Taxpayers Alliance, June 2004 income, and poverty).
Inputs
A growing population usually means a growing workforce capable of producing more goods and services, as well as a growing consumer base that can purchase those goods and services. Growth in these inputs helps to fuel growth in output. These two measures (population and workforce) are interconnected and somewhat interdependent. As such they are discussed together.
Outputs
Output is a direct result of human inputs. Perhaps the most common measure of economic output is gross domestic product (GDP), or the value of all goods and services produced in an economy. Inflation-adjusted real GDP growth from 2017 to 2024 is used here to measure this critical indicator of economic prosperity.
Outcomes
Finally, the desired effects of a strong economy, that is rising real GDP fueled by growth in the population and workforce, can be measured in various ways. Here, three income measures are examined.
One of the broadest and widely used measures of income is “personal income,” which is reported by the U.S. Bureau of Economic Analysis each year. For a state or county, it is the total income that residents receive from “wages and salaries, Social Security and other government benefits, dividends and interest, business ownership, and other sources.” To compare states and counties with varying populations, it is typically measured on a per capita basis (PCPI).
Another commonly used income measure is median household income, which is estimated via survey data by the U.S. Census Bureau. This is the income level at which half of households in the area studied have higher incomes and half have lower ones. Both PCPI and median household income growth measure the change in income directly.
Finally, the poverty rate is the share of households with incomes below the poverty level. The change in the poverty rate indirectly measures income change among low-income families.
EVALUATING WISCONSIN
When looked at in isolation, Wisconsin’s economy has performed reasonably well since 2017. Output increased, incomes rose moderately, and poverty declined. Yet, economic vitality should not be measured in isolation. Wisconsin competes with other states, regions, and increasingly with other countries for workers, residents, and investment.
As the growth in working-age population in Wisconsin and the region slows, and in some cases declines, and as the fertility rate in the state and country continues to drop, competition for workers and residents will only intensify. As such, a modestly growing economy may not be sufficient to truly thrive.
The analysis that follows evaluates each of the six economic indicators at the state level and compares them to national figures. For the six growth measures examined, we rank each state in the nation and discuss how these ranks have changed over time. Since these indicators are also regional in nature, this report also measures them at the county level and compares them to counties across the nation.
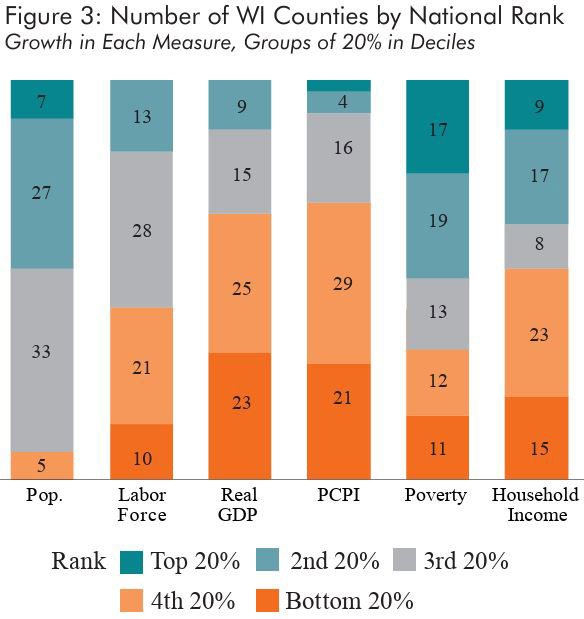
At the local level, we place each county into a decile (group of 10%) based on their performance relative to all other counties. The first decile is comprised of those in the bottom 10% while the 10th decile is made up of the top 10%.
INPUTS — POPULATION AND WORKFORCE
As discussed previously, changes in the population and workforce are largely related to changes in economic outputs and outcomes.
Wisconsin vs. the Nation
From 2017 through 2024, Wisconsin’s population grew by 2.1%, continuing a pattern of slow growth that was less than both national growth (4.1%) and the 2.6% increase Wisconsin experienced between 2010 and 2017. Compared to other states, Wisconsin was in the bottom third, ranking 34th. This was a slight improvement over its 36th place ranking during the 2010-17 period.
Nationally, the largest increases were seen in Idaho, Utah, Florida, Texas, and Nevada. Five states experienced population decline, including neighboring Illinois (-1.6%).
The labor force in Wisconsin followed a similar, but more troubling pattern, increasing just 1.1% from 2017 through 2024. This was well below the national increase of 5.8% and below the state’s growth of 1.9% in the preceding seven-year period. Relative to other states, Wisconsin’s position worsened, falling from 31st in the prior period to 39th in the most recent seven-year period.
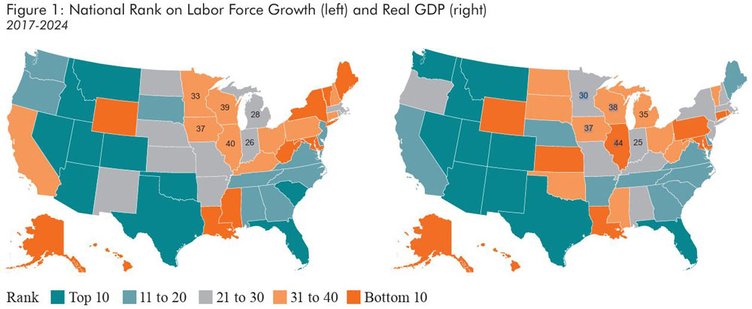
Only 11 states performed worse on this critical measure, including neighboring Illinois, whose labor force grew by 1.0%. Notably, Illinois achieved this growth despite a declining population. Figure 1 shows labor force growth by state, in groups of 10. Workforce growth was strongest in southern and western states and considerably weaker in the Northeast and Midwest. The maps in Figure 1 suggest a clear relationship between the change in labor force and the change in real GDP across states. While the visual association does not imply causation, it provides useful context for the comparisons discussed in this report.
County Performance: Population and Workforce
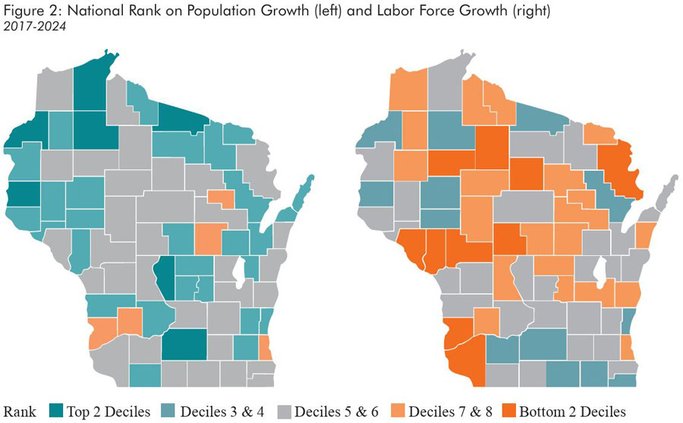
Among the six economic indicators examined, population growth represents the strongest area of performance for Wisconsin counties relative to their performance on other measures. From 2017 through 2024, 34 counties exceeded the state’s 2.1% population growth.
Seven Wisconsin counties ranked in the top 20% nationally on population growth (Adams, Bayfield, Burnett, Dane, St. Croix, Sawyer, and Vilas). Another 51 counties were in the top half of all counties. At the same time, 14 were in the bottom half nationally, which is a relatively small number compared to Wisconsin counties in this position in other metrics.
Statewide labor force challenges have been the subject of public discourse for many years. Indeed, our recent reports have discussed these issues in detail. As such, Wisconsin counties’ fairly poor performance on labor force growth may not be a surprise. Thirty-two counties saw their work forces decline from 2017 through 2024. In Crawford, Grant, Jackson, Lincoln, Price, Rusk, and Trempealeau counties, declines were greater than 5%. Nationally, Wisconsin counties fared much worse. No counties in Wisconsin were in the top two deciles, and just 13 were in the top 40% nationally. Indeed, labor force growth in 44 of the state’s counties were in the bottom half of all counties nationwide. Ten counties were in the bottom 20%.
The divergence between population growth and workforce decline was widespread in Wisconsin. In 61 of the state’s 72 counties, population growth exceeded growth in labor force. The median difference was two percentage points (double the state gap). In 17 counties, all rural and mostly located in northern Wisconsin, population growth exceeded labor force growth by at least five percentage points.
These large gaps generally reflect aging populations leaving the labor force, retirements, or growth in the population of children. The widest gaps (over nine percentage points) were in Price, Trempealeau, Crawford, and Rusk counties.
Five counties saw the reverse, with labor force growth exceeding population change by at least two percentage points. Kenosha County led the way with a seven-percentage point difference. The other four with smaller positive gaps were Walworth, Rock, Lafayette, and Dodge counties.
When compared nationally, Wisconsin counties performed comparatively well on population growth and poorly on growth in the labor force.
The population and workforce changes experienced by Wisconsin and many of its counties point to a fundamental demographic challenge. Many Wisconsin counties are adding residents, but far fewer are adding workers. When workforce grows slower than population, economic capacity and competitiveness are limited, especially compared to other states and counties that are increasing their work forces.
OUTPUT — REAL GDP
Evaluating Wisconsin’s real GDP, and county level figures relative to other states and counties shows how growth has been distributed across the nation and state.
Wisconsin vs. the Nation
Over the past seven years, real GDP increased 10.1% in Wisconsin. Despite this seemingly healthy growth, the state lagged other states by a wide margin. Nationally, U.S. output rose 19.1% during the same period, nearly double Wisconsin’s increase. This difference is not new. In every seven-year period since at least 1997-2004, Wisconsin’s growth in real GDP has been less than the growth nationally. What is troubling, though, is that the gap has been widening.
In the early to mid 2000s, the gap averaged less than three percentage points. In the last half of that decade, the gap widened to as much as 5.5 percentage points. Wisconsin closed the difference in the first half of the 2010s so that by 2015, seven-year growth here was about two percentage points below the nation. Since then, the gap between Wisconsin and the nation has again widened considerably.
Over the past 21 years, Wisconsin’s seven-year growth ranked in the top half of states on this measure only once, in 2015 (23rd). It ranked among the top 30 only four times. In the most recent seven-year period studied, Wisconsin ranked 38th among the states. The state’s 10.1% growth outperformed only Alaska, Connecticut, Hawaii, Illinois, Kansas, Louisiana, Maryland, Oklahoma, Pennsylvania, Rhode Island, West Virginia, and Wyoming. Among neighboring states that outperformed Wisconsin, Minnesota (12.6%) led the way, followed by Michigan (11.9%) and Iowa (10.3%).
County Performance
Given their workforce struggles, it is not surprising that Wisconsin counties as a whole fared poorly on real GDP growth. Twenty-six counties experienced declines in this metric. Of the 26, 12 mostly rural counties saw reductions of 5% or more. At the same time there were Wisconsin counties with relatively strong growth, with 12 showing gains of more than 10%.
National comparisons confirm the state’s relative weakness. Wisconsin had no counties in the top 20% nationally, nine in the top 40% with four — Dane, Iowa, Rock, and Pepin — in the top 30%.
Instead, over 80% (59) of Wisconsin counties were in the bottom half nationally on real GDP growth. Nearly a third (23) were among the bottom 20% with 11 in the bottom 10% of counties.
OUTCOMES IN INCOME
Together, PCPI, median household income, and the poverty rate provide insight into how economic growth is broadly shared. The following sections evaluate Wisconsin’s performance on these economic indicators relative to other states and across counties.
Wisconsin vs. the Nation
Growth in the state’s inflation-adjusted PCPI significantly outpaced median household income. However, relative to growth in other states, it lagged. The state’s 9.6% increase ranked 38th nationally compared to 34th for median household income.
Wisconsin’s median household income rose just 1.3% after adjusting for inflation. Thirty-three states performed better on that measure. Neighboring Illinois (2.5%, 29th) and Michigan (1.4%, 33rd) achieved slightly greater growth. Minnesota (0.1%, 43rd) and Iowa (-1.8%, 49th) ranked in the bottom 10. The top five states on household income growth were Idaho, Florida, Vermont, Arizona, and Utah.
Examining PCPI and median household incomes often distorts the view of lower earning residents. As such, measuring the share of those living below the poverty line sheds more light on residents on the lower end of the income spectrum. Contrary to personal income and household income, Wisconsin’s relative performance on poverty was its best showing. The state’s poverty rate dropped from 11.3% to 10.6%, a decline that ranked 28th among the states.
County Performance
Wisconsin counties generally fared poorly on two of the three income measures. There were, however, some positives.
On PCPI and household income, more than half of Wisconsin counties ranked in the bottom half of counties nationally. Wisconsin counties performed the worst in the broadest income measure (PCPI), with 60 of the state’s 72 counties in that ranked in the bottom half. Performance on median household income was slightly better, though 43 counties ranked in the bottom half. However, Iron, Marquette, Waushara, Vernon, and Vilas ranked in the top 10%.
Counties generally performed better on decreasing their poverty rates. While 30 counties ranked in the bottom half of counties, 36 were in the top 40%, with 17 in the top 20% nationally. Barron, Bayfield, Eau Claire, and Vernon counties placed in the top 10% nationally.
WISCONSIN’S PERFORMANCE
Wisconsin’s performance relative to other states since 2017 is disappointing on two levels. First, the sum of Wisconsin’s ranks on the six measures was 18th worst in the nation. Second, on three measures the state’s relative performance worsened significantly compared to the prior seven-year period. On PCPI growth, Wisconsin dropped 15 spots. On both labor force and real GDP change, the state fell eight spots. The state moved up one to three spots on the other three measures.
Overall, Wisconsin’s performance lagged in all six indicators studied here. Ranked 34th in population growth and 39th in labor force change, the state was in the bottom third nationally on core demographic measures. Economic output and outcomes were similar, with Wisconsin ranking 38th in both real GDP growth and PCPI growth. Median household income growth was moderately stronger, but still below average. The state’s best relative performance was in poverty reduction, where it ranked 28th.
Comparisons across all U.S. counties are instructive, but they should be interpreted with caution because counties can vary widely in size, population density, and level of urbanization. For example, in these specific measures at the national level, urban counties generally outperformed rural counties. However, when comparing only Wisconsin’s rural counties to other rural counties across the country, the rankings are very similar to the overall analysis. Wisconsin rural counties generally outperformed on population, but lagged on other measures.
FINAL THOUGHTS
Wisconsin’s economic performance since 2017 presents a mixed and challenging picture. The state’s economy has continued to grow as shown by increasing output, modestly growing incomes, and declining rates of poverty. Viewed in isolation, these trends show that Wisconsin’s economy has been resilient through a period marked by demographic change, a pandemic, and shifting labor markers. Yet, such growth should not be viewed in a silo. Regional and national labor force challenges combined with shrinking fertility rates portend ever-increasing competition for residents, workers, and taxpayers.
Across all six measures examined in this report, Wisconsin generally lagged other states. In several cases, the state’s relative position declined compared to the previous seven-year period. These patterns are echoed at the county level.
The workforce trends mentioned at the beginning of this report remain key to understanding these patterns. Slow growth in the population and labor force have contributed to constrained economic output and limited gains in personal and median income.
Wisconsin’s challenge is not the lack of growth, but instead, its anemic growth relative to other states and counties. In an era of intense competition for workers and residents, modest levels of economic growth may not be sufficient. Wisconsin’s economic future will be shaped by how the state adapts to comparatively small increases in economic inputs, meaning the population and workforce. Addressing these issues will help the state grow in terms of output (GDP), and outcomes such as the ones discussed here (personal income, median household income, and poverty).
According to the U.S. Census Bureau, there are more than 3,100 counties or “county-equivalents” in the nation. Louisiana’s parishes and Alaska’s boroughs are two prominent examples of county equivalents. For the remainder of the report, references to “counties” in a national context refers to both counties and “county equivalents.”
Forward Analytics is the research division of the Wisconsin Counties Association. Its mission is to use data to identify challenges facing Wisconsin and share this information with state and local leaders to help them make informed policy decisions. Forward Analytics is led by Director Kevin Dospoy.